 Manual home
Send Feedback
Manual home
Send Feedback
 Print
Print
|
|
|
|
|
Display settings
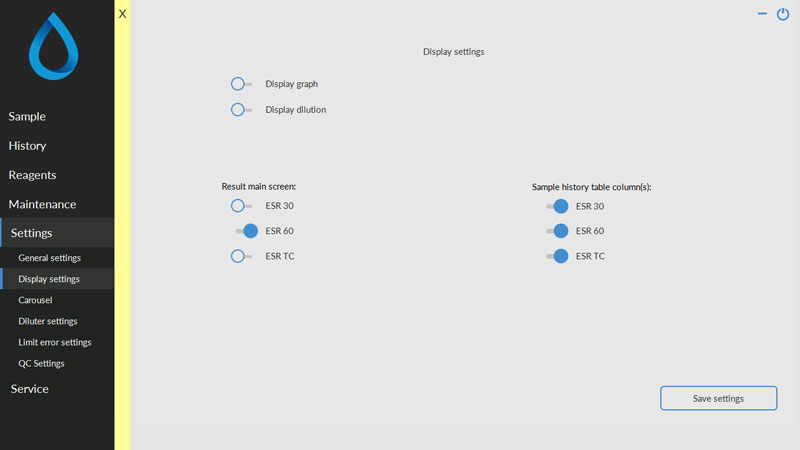
Display graph:
- Display graph ON: A graphical presentation from the measured sample data is shown on the Main screen.
Display graph OFF: Default setting, no graph is shown.
Display dilution:
- Display dilution ON: The dilution rates of all samples are shown in the status line on the screen directly after aspiration.
- Display dilution OFF: Dilution rates are only shown if they are outside the selected accepted range.
Results main screen:
To show ESR30, ESR60 and/or ESR TC result on the sample screen during sampling. Possible settings depends on general settings (ESR30 ON/OFF and Temperature correction ON/OFF)
Sample history table column(s):
To show ESR30, ESR60 and/or ESR TC as a column in the Sample history screen. Possible settings depends on general settings (ESR30 ON/OFF and Temperature correction ON/OFF).
In This Section |
See Also |
Mechatronics home
Send Feedback
Print
|
Page last reviewed: 10/04/2018 11:22:53 (Version: MRN--EN) ©2019 RR Mechatronics |