 Manual home
Send Feedback
Manual home
Send Feedback
 Print
Print
|
|
|
|
|
ESR Statistics screens
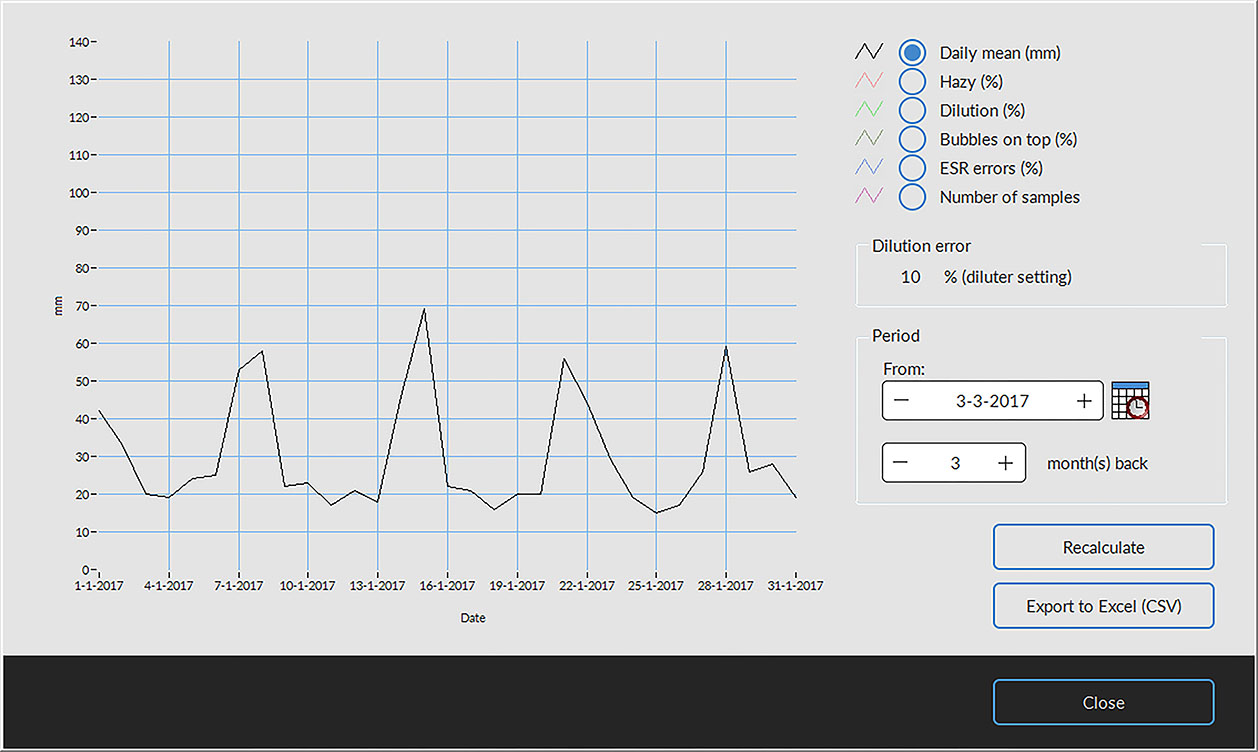
A statistical graph is produced over a selected period. Make a selection of the following graphs;
- Daily mean (mm)
Use this to check variations in the daily mean ESR. - Hazy (%)
Increasing hazy aspects are an indication for contamination of the instrument, see Aspect Hazy - Dilution (%)
Increasing dilution errors indicate the need for maintenance of the diluter system. - Bubbles on top (%)
Increasing samples with bubbles indicate the need for maintenance of the aspiration system, see Foam in column - ESR errors (%)
Increasing ESR errors may indicate the need for maintenance, see ESR Error - Number of samples
This can be used to document variations in work load.
See Also |
Mechatronics home
Send Feedback
Print
|
Page last reviewed: 24/07/2018 13:41:39 (Version: 2.01 (04-05-2022) MRN-124_2-EN) ©2022 RR Mechatronics |