 Mechatronics home
Send Feedback
Mechatronics home
Send Feedback
 Print
Print
|
|
|
|
|
RBC aggregation screen
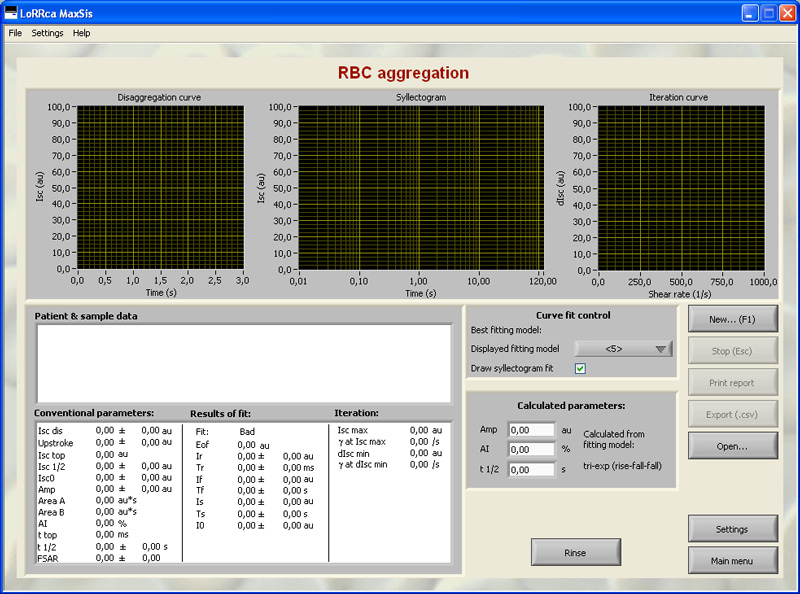
The next figure shows the window that appears when starting RBC aggregation test. See Aggregation settings and the following option selections for details on the Settings parameters that influence the measurement.
- Disaggregation level.
- Syllectogram, following cup cessation.
- Iteration curve (I(g)) retrieving the threshold shear rate.
- Results area.
- Syllectogram model selection, control for displaying the curve fit and an indication of the best-fitting model
In This Section |
See Also |
Mechatronics home
Send Feedback
Print
|
Page last reviewed: 03/05/2010 11:33:51 (Version: 5.00 MRN-231-EN) ©2010 Mechatronics BV. |