 Mechatronics home
Send Feedback
Mechatronics home
Send Feedback
 Print
Print
|
|
|
|
|
Stability Curve determination screen
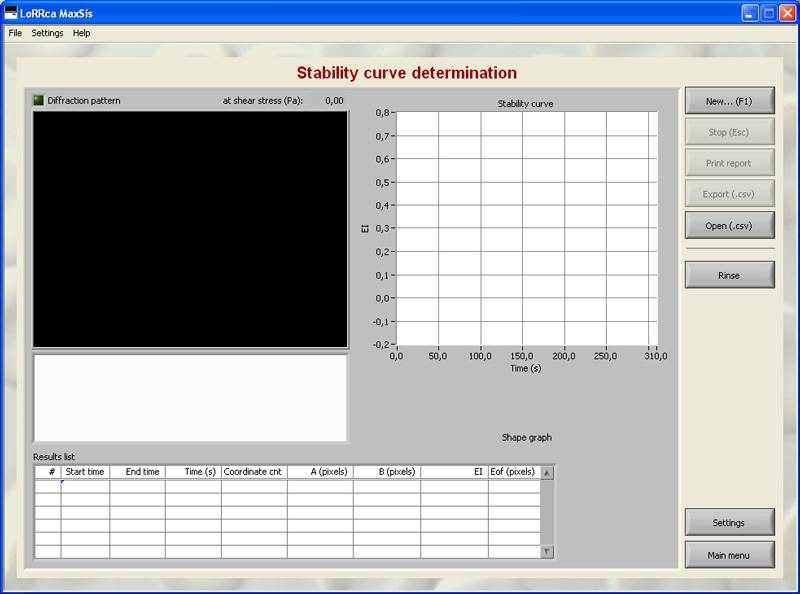
The next figure shows the window that appears when starting a stability test. See Stress curve determination for details on the Settings parameters that influence the measurement.
A measurement starts after subsequently clicking <New...(F1)>.
On this screen are shown:
- Coloured diffraction pattern.
- Curve display screen.
- Indication of cell shape.
- Measurement and sample details.
- Measurement results.
In This Section |
See Also |
Mechatronics home
Send Feedback
Print
|
Page last reviewed: 03/05/2010 11:56:11 (Version: 5.00 MRN-231-EN) ©2010 Mechatronics BV. |