 Manual home
Send Feedback
Manual home
Send Feedback
 Print
Print
|
|
|
|
|
Display sample history (QC)
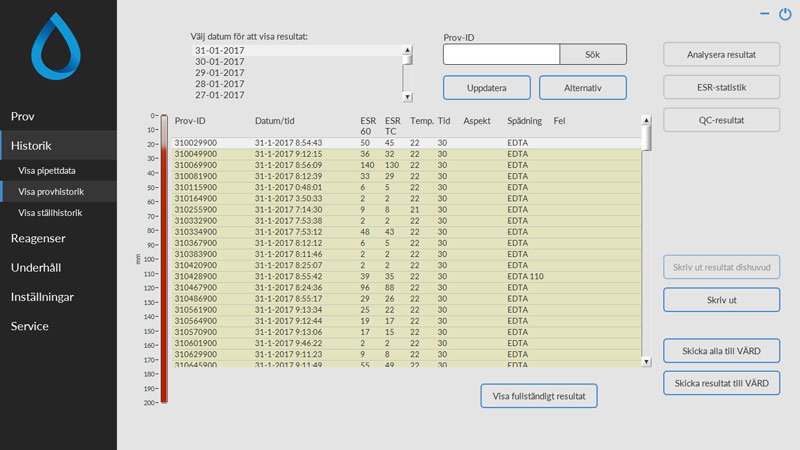
This screen shows all patient results that have been measured after the selected QC result and up to the following QC result. The results are presented in the layout of the "Display sample history" screen. Depending on the frequency of QC samples, related patient results may span over multiple days and are listed per date. All general ESR data and errors of QC samples are shown here.
See Also |
Mechatronics home
Send Feedback
Print
|
Page last reviewed: 21/08/2018 11:45:28 (Version: 2.01 (04-05-2022) MRN-124_2-EN) ©2022 RR Mechatronics |