1
|
Carousel:
This is a graphical representation of the carousel. When an ESR is required the carousel is moving to the Measure position. On the display, the belt is also moving accordingly. The decimal numbers next to the pipettes are the numbers on the pipette belt.
When a pipette is filled successfully, a red dot marks the filled pipette. In case of a failure the pipette is marked with a flashing red dot.
All the sample information can be found in tab .
|
2
|
Measure station:
This is the position of the measure station where the ESR of the sample is measured.
|
3
|
Wash station: (Also named Rinse station)
This is the position where the sample is washed out of the pipette. The pipette is clean and dry after this process.
|
4
|
Fill station:
This is the position where the pipette is filled with a blood sample.
|
5
|
Rack:
This is a representation of a rack in process. Empty positions indicate, that no sample tube was detected at that position.
The combinations of the pictograms have the following meaning:

|
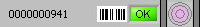
Barcode could not be read (read failure).
|
|
Barcode was read correctly, waiting for response from LIMS
|
|
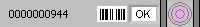
Barcode was read correctly, but ESR is not required for this sample.
|
|
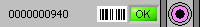
ESR is required and waiting to be done.
|
|
ESR was measured successfully.
|
|
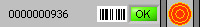
ESR was measured, but with fill errors.
|
After processing the rack, the information of the rack is transferred to the .
|
6
|
Pipette:
This is a graphical representation of the pipette. It is generated from the results of the ESR measurement. It can be used to locate possible air bubbles.
|
7
|
Sample mode button:
This is the button to start or stop the run mode of the instrument.
|
8
|
Version information and help:
Shows the version information of the software.

Click on the question mark for Instructions for Use (normal mode) or the error list in case of an error message. When the Service mode is activated, extended user information is shown.
|
9
|
Sample information:
After measurement, the results of the sample are shown in this window. This window is refreshed after every new result of a sample.
|
10
|
Status:
Information about the current status of the instrument is shown here, such as the selected mode (EDTA or Citrate), selected method (60 or 30 minute) and symbols that draw attention to certain maintenance conditions or QC sample status (if applicable).
|
11
|
Manual input sample ID:
Can be used for manual input of a barcode from a sample tube.
|
 Manual home
 Print
Print