 Mechatronics home
Send Feedback
Mechatronics home
Send Feedback
 Print
Print
|
|
|
|
|
Iteration procedure
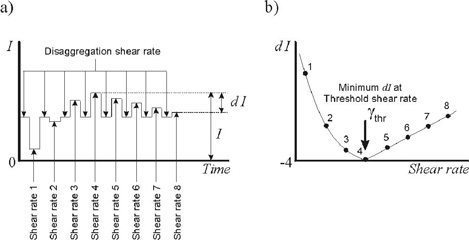
For diagnostic reasons it is often desirable to know the threshold shear rate. (Reference 6) This threshold is found from the back scatter vs. shear rate curve as the shear rate where a peak is detected. At this point, the RBCs balance between aggregating and disaggregating. The threshold shear rate is a sensitive parameter to demonstrate hyperaggregation and can not be found from the syllectogram. With the LORCA it is possible to search for the threshold shear rate in two ways:
- With intermediate disaggregation (recommended).
In this mode (see Figure 7) the program first disaggregates the RBC suspension before measuring at each user defined (lower) shear rate. This may be favourable as the standard procedure since potential aggregates will break down during disaggregation resulting in the same starting point before each back scatter measurement at a given shear stress. A user-defined list of shear rates is first processed to get a rough impression of the threshold shear rate. When intermediate disaggregation is enabled, which is preferable, the difference between the back scatter during disaggregation and that at each subsequent user defined shear rate (dIsc) is determined vs. user defined shear rate. Next, a binary search algorithm is used to automatically generate two more shear rates to fine-tune the rough procedure. Each binary search step results in two more shear rates to measure the back scatter intensity. They are chosen centered between the current optimum shear rate and next higher and lower shear rates. The number of binary search steps that is used for optimization is also user defined. From this so-called iteration procedure the shear rate with the lowest dIsc is pointed out as the threshold shear rate.
|
|
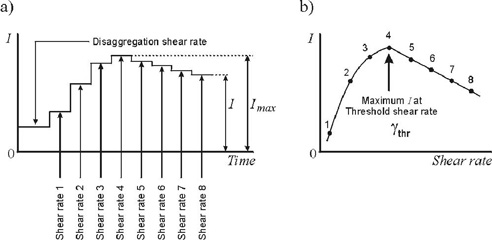
- Without intermediate disaggregation.
This mode (Figure 8) is very similar to the former but without intermediate disaggregation. The absolute value of the back scatter intensity at each shear rate serves to determine Isc vs. shear rate. The threshold shear rate is taken where the back scatter intensity is the highest. Note that some aggregates might still remain at the threshold shear rate. Therefore, during the iteration procedure, the back scatter level (aggregation level) at the threshold shear rate may differ from the peak value in the Syllectogram.
|
|
See Also |
Mechatronics home
Send Feedback
Print
|
Page last reviewed: 19/05/2011 13:37:10 (Version: 5.00 MRN-231-EN) ©2010 Mechatronics BV. |