 Mechatronics home
Send Feedback
Mechatronics home
Send Feedback
 Print
Print
|
|
|
|
|
Syllectometry
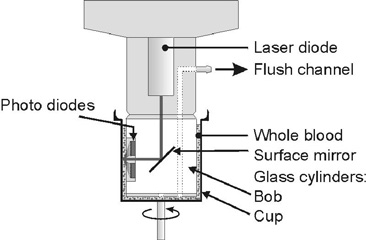
Syllectometry as originally described by Zijlstra (References 10,65) is commonly employed to measure RBC aggregability. (References 6,22,23,31,36,44,48,54,57) In this method blood is illuminated and subjected to shear stress, causing the cells to deform and align in the direction of the flow (Figure.5). The change in back scattered light is measured after the driving mechanism stops. (The time needed for the suspension to come to a stop influences the syllectogram and its derived parameters for large gaps (> 0.6 mm), see References 15 or 16 for details.) The resultant time-dependent intensity plot is called a syllectogram. A high intensity peak shows up at the beginning of the plot as cells return to their original randomly-oriented biconcave shape and lose their alignment. The intensity of the back scattered light decreases as aggregation proceeds. A mathematical representation of the syllectogram yields aggregation parameters that are used to assess RBC aggregability.(References 6,23,31)
|
|
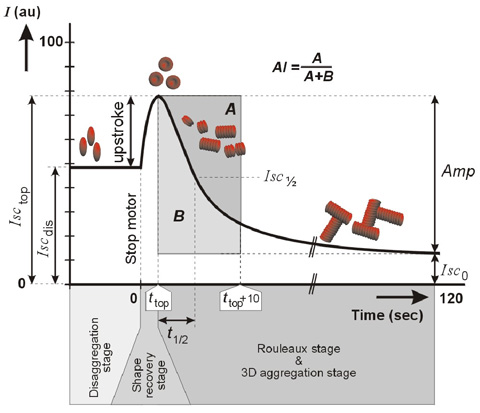
In a syllectogram, four RBC-behavioural stages are distinguished (Figure 6).
These are:
- The initial plateau during the disaggregation stage originates from the light that is back scattered by the elongated RBCs that are aligned in the direction of the flow. The intensity of the light relates to the state of elongation and thus depends on the shear rate.
- In the shape-recovery stage that follows immediately after cup cessation, cells collectively lose their alignment and return to their biconcave resting shape. The recovery stage is accompanied by an exponential increase in light back-scatter (References 5,34,59) leading to a high intensity peak in the syllectogram.
- Aggregation starts during the shape-recovery stage when external shear forces fail to keep the RBCs dissociated. RBCs start to aggregate side-to-side as stacks of coins, called rouleaux, causing the back-scatter of light to decrease exponentially (Reference 25) with a time-constant of about 1 -3 s in normal human blood.
- Rouleaux formation is immediately followed by so-called 3D aggregate formation during which rouleaux connect end-to-end as well as side-to-end, creating larger 3D aggregates. In normal human blood, the formation of 3D aggregates is a slower process (Reference 6) with a time-constant of about 10 - 25 s.
|
|
See Also |
Mechatronics home
Send Feedback
Print
|
Page last reviewed: 19/05/2011 13:36:24 (Version: 5.00 MRN-231-EN) ©2010 Mechatronics BV. |