 Mechatronics home
Send Feedback
Mechatronics home
Send Feedback
 Print
Print
|
|
|
|
|
Deformability curve
When measuring a deformability curve (EI vs. shear stress), the RBC suspension is kept at an adjustable temperature (usually 37 şC). The applied shear stress is computer controlled and is adjustable in the range 0.01 - 100 Pa. The laser light traverses the blood suspension and will partially be diffracted by the RBCs. Under the influence of shear stress, RBCs elongate accompanied by a shape change of the diffraction pattern. The following drawing shows how the diffraction pattern is made visible on a small projection screen:
|
|
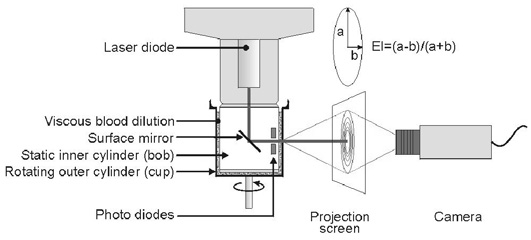
A video camera acquires the diffraction pattern from the projection screen and transmits it to the image acquisition board of the PC. Finally, the computer calculates the best matching ellipse (curve fit) and determines the Elongation Index (EI) from the horizontal (B) and vertical (A) axes (Figure 1 and Figure 2) according to:
![]() (Equation 3)
(Equation 3)
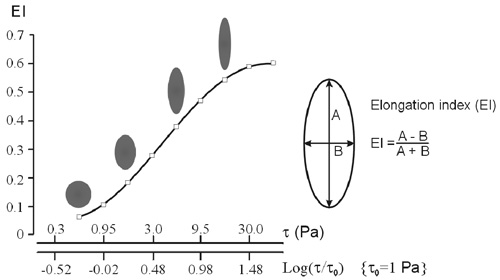
When deforming under increasing shear stress, RBCs change gradually from a biconcave towards a prolate ellipsoid morphology and orient themselves along the flow vector in the gap, i.e., tangential to the axis. This is accompanied by a transition from a circular into an elliptic diffraction pattern, which is oriented perpendicular to the orientation of the elongated cells. The elongation program measures the EI at shear stresses in an optional range and draws EI vs. shear stress, known as the deformability curve. Figure 2 shows this deformability curve and the shape of the accompanying diffraction patterns.
|
|
See Also |
Mechatronics home
Send Feedback
Print
|
Page last reviewed: 19/05/2011 13:33:23 (Version: 5.00 MRN-231-EN) ©2010 Mechatronics BV. |