 Mechatronics home
Send Feedback
Mechatronics home
Send Feedback
 Print
Print
|
|
|
|
|
Diaphragm adjustment and sample thermostation
The measurement procedure can be cancelled by clicking “Cancel”. If the procedure is continued, by clicking the “Ok” button, a new window appears in which the operator is asked to adjust the camera diaphragm to scale the diffraction pattern for maximum size within the screen. The applied shear stress (<Settings> <Shear> stress for camera adjustment>) is taken high enough to fully elongate the cells in order to get a maximum elliptical diffraction pattern.
|
|
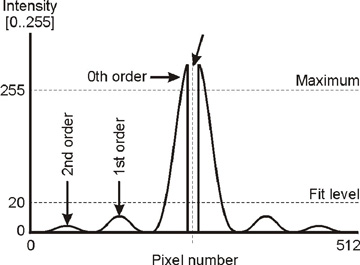
The original image is a gray scale image containing an intense zero order diffraction pattern and some weak higher order patterns. Figure. 9 shows the intensity distribution of a single image line. The intensity drop in the middle of the zero-order peak is caused by the laser absorber dot, which prevents camera overexposure. The smaller peaks at both sides of the zero-order peak represent the higher orders. When opening the diaphragm, light intensity increases, hereby increasing also the higher order patterns. As soon as the intensity of the higher order patterns exceed the "Fit gray level" (see <Settings><Fit gray level>), they participate in the iso-intensity curve and the pattern ellipse is detected incorrectly. When the diaphragm is closed too far, the diffraction pattern can hardly be distinguished from the laser spot, which also results in a wrong detection of the iso-intensity curve. Thus, the diaphragm should be opened to scale the diffraction pattern for maximum size within the screen, yet without including higher order diffraction patterns and without introducing secondary reflections.
Since it is difficult to distinguish the zero-order diffraction pattern from higher order patterns within the gray-scale image, each gray level (range 0..255) is assigned a colour. The on-screen diffraction pattern is created using this colour look up table (see table Colour look-up table).
The “User colours” checkbox can be used to switch between gray images and colour images. Click the “Ok” button if the camera diaphragm is well adjusted and the sample has reached the desired temperature.
Gray level |
Colour |
0 |
Black |
1..Fit gray level |
Dark..Light blue |
Fit gray level..Fit gray level + higher levels |
Black |
Rest..254 |
Dark..Light red |
255 |
White |
Table, Colour look-up table definition for converting gray scale images into colour images.
See Also |
Mechatronics home
Send Feedback
Print
|
Page last reviewed: 19/05/2011 13:37:36 (Version: 5.00 MRN-231-EN) ©2010 Mechatronics BV. |