 Manual home
Send Feedback
Manual home
Send Feedback
 Print
Print
|
|
|
|
|
QC Normal results (table)
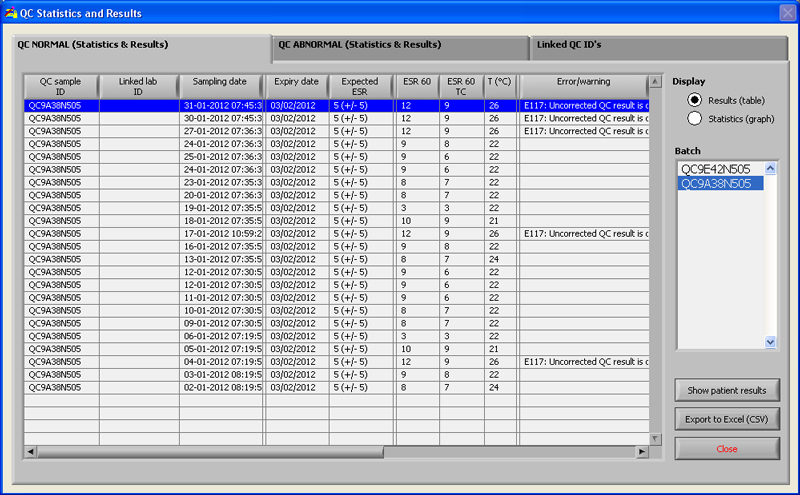
Display Results (table):
Results are shown in table as default.
QC sample ID:
Read from the barcode. The original Starrsed Control barcode (=batch number)
Linked lab ID:
The Lab ID is given if it is linked to the Starrsed Control sample ID
Sampling date:
The date and time when the QC sample was aspirated.
Expiry date:
If the Starrsed Control expiry date is exceeded, it is not possible to continue with this QC sample. The sample is not measured, but the failed attempt is logged in the table.
Expected ESR:
This is the temperature corrected mean value (incorporated in the Starrsed barcode) and the accepted range of deviation. The applicable values for the acceptable range depend on the user setting.
ESR 60:
Uncorrected result from QC sample.
ESR 60 T.Corr.:
Temperature corrected result from QC sample.
T(°C):
Temperature at which the sample was measured.
Error/Warning:
Only special QC errors are mentioned here, general ESR warnings/errors are mentioned in the next column.
After these columns additional data is shown: pipette number, dilution rate, ESR30, ESR time and Aspect. Scroll to the right.
Results are always shown with and without Temperature correction, independent of the setting Temp. Correction (ON or OFF).
The following options can be selected:
Related patient results
This screen is simular to the "Display sample history" screen. The background colour of the patient history table is switched to light yellow to distinguish these QC related patient results from the standard patient history table. Depending on the frequency of QC samples, related patient results may span over multiple days and are listed per date.
Export to Excel (CSV)
Results can be exported to a .CSV file and imported in an MS Excel file for further analyses.
Batch
All used batches of Starrsed Control are shown, results are shown for chosen batch ID.
Close
Return to History screen (History screen, History screen).
See Also |
Mechatronics home
Send Feedback
Print
|
Page last reviewed: 16/06/2017 09:33:30 (Version: MRN--EN) ©2019 RR Mechatronics |